How to use Wireshark, the best known and most effective packet sniffer, recently reached its third version.
Among the software tools for network analysis Wireshark is certainly one of the best known and used. The Internet and LAN networks that we all use today are examples of packet switching networks: there is no “construction” of a direct communication channel between source and destination of data; the network is instead available to several users who can send and receive information simultaneously.
A protocol analyzer is software that listens on the network and captures the data packets in transit, showing all their peculiarities, reorganizing them, and allowing searches to be carried out.
Thanks to a packet sniffer like Wireshark, it is possible check which activities are taking place on the local network and collect useful information on any communications carried out in an insecure manner: for example, the transmission of access credentials in an unencrypted form, unauthorized data exchange and so on.
A network card (on Ethernet or WiFi interface) of any device connected to the LAN, by default, receives only the data packets intended for it.
The “secret” of Wireshark consists of using the so-called promiscuous mode: by setting it in this way, the card becomes able to “intercept” all the traffic in real-time, including that directed to other devices or originating from them.
By default, Wireshark captures packets in promiscuous mode.
Unlike tools such as Charles, which act as proxy servers and require an intervention on the configuration of the individual devices connected to the local network, Wireshark listens on the LAN, automatically recognizing and analyzing all packets in transit.
Ours is not intended to be a complete tutorial on Wireshark but rather a guide to using the main features of the famous and appreciated packet sniffer .
To download the latest version of Wireshark, which recently embraced the new Ncap driver for data packet capture, just refer to this page.
Wireshark is available in the Windows version and those compatible with macOS and Linux systems (downloadable from here ).
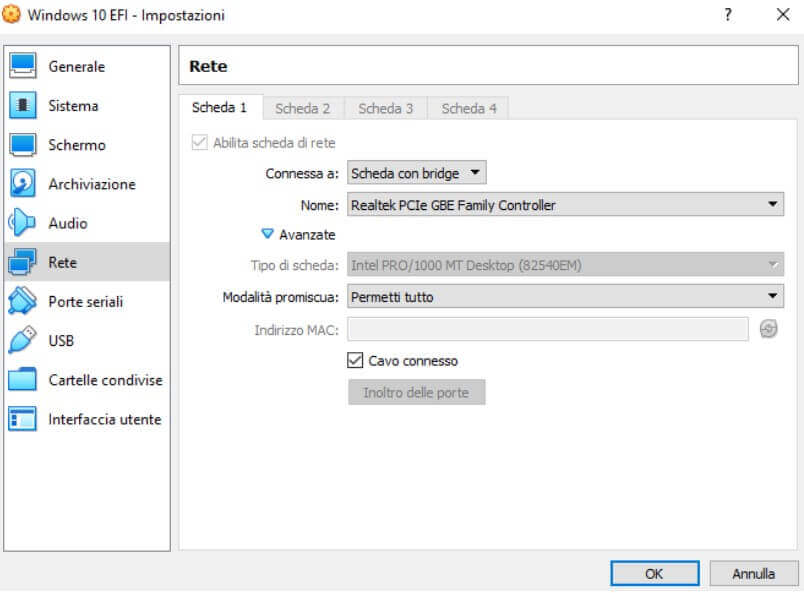
Wireshark can also be installed and used inside a virtual machine to detect and analyze all network traffic. The important thing is to set the virtual Card in bridge mode and activate the promiscuous mode.
For example, in the case of Virtualbox, it is sufficient to go to the network settings and then select Card with the bridge in correspondence with Connected to and Allow all from the drop-down menu Promiscuous mode.
To use Wireshark, it is essential to use an account with administrative privileges.
How to configure Wireshark for first use
When Wireshark starts, the program asks you to indicate the network interface you want to activate the capture and analysis of data packets. The interfaces’ names correspond to those that appear in Windows by pressing the key combination Windows + R and then typing ncpa.cpl .
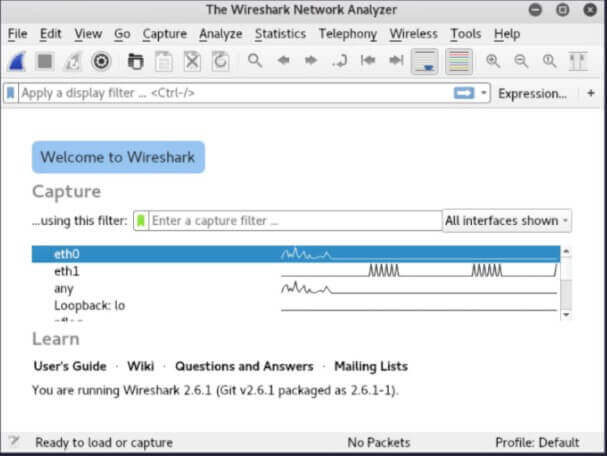
It will therefore be necessary to click on the network interface with which the system in use is connected to the LAN.
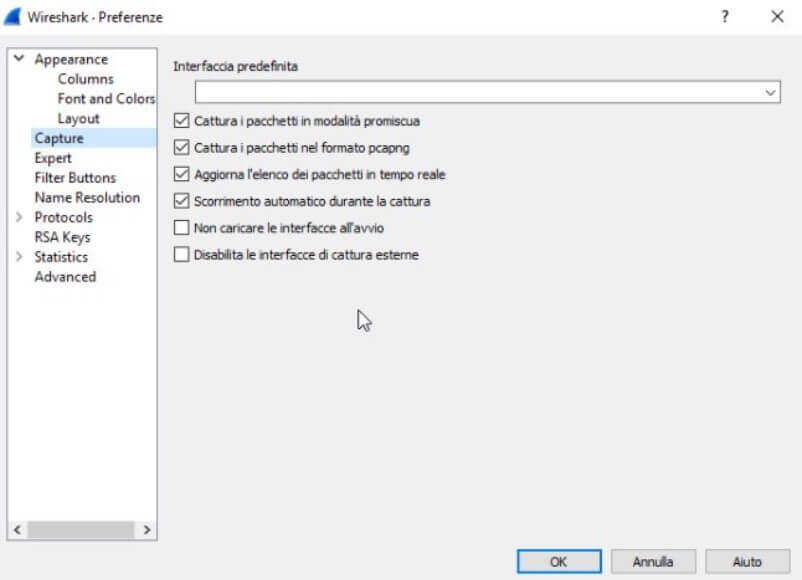
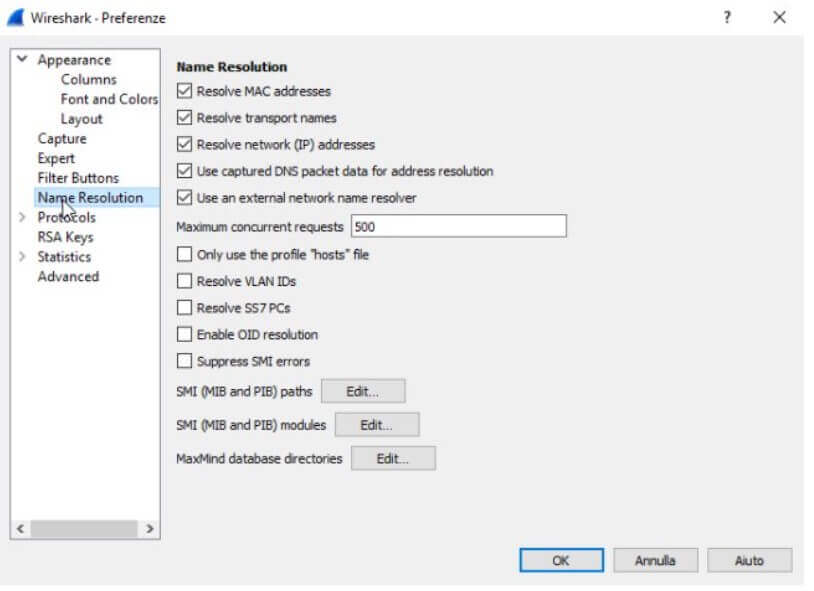
Referring to the Edit menu , Preferences then choosing Name resolution from the left column, we suggest checking all the boxes under the Name resolution indication . By doing so, Wireshark will resolve all IP addresses by showing in their place, where possible, the name of the corresponding domain or system.
By clicking on the first icon from the Wireshark toolbar’s left (it represents the fin of a shark), the program will start the capture and analysis of data packets in transit.
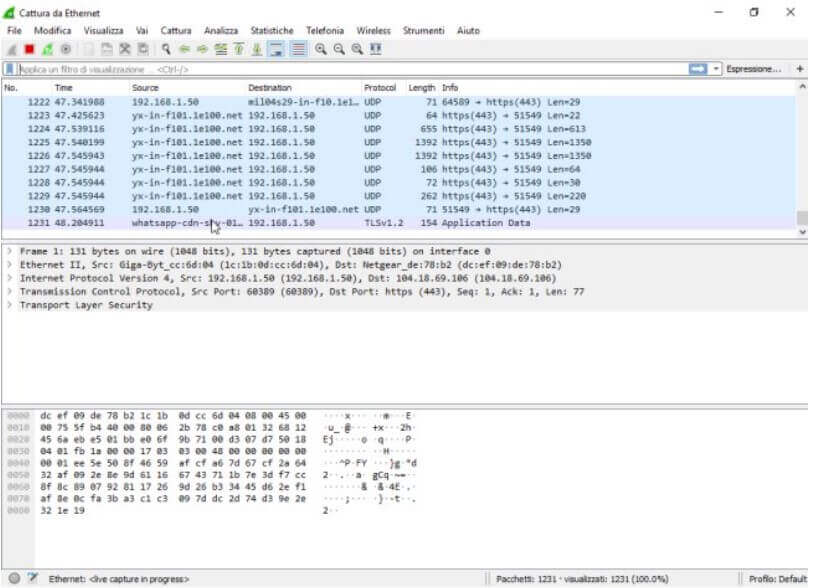
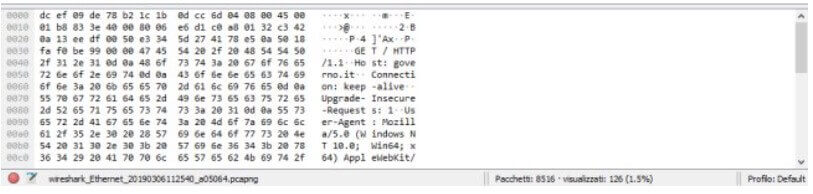
Initially, the Wireshark window will be completely unreadable: hundreds of lines containing source, destination, protocol, and a series of information will follow one another continuously. By clicking on any line, it is possible to read the contents of the selected package.
In the case of HTTPS packets or any case of all encrypted data packets (SSL / TLS), the data will not be readable. At the same time, through Wireshark, it will be possible to directly access the content of the unencrypted packets.
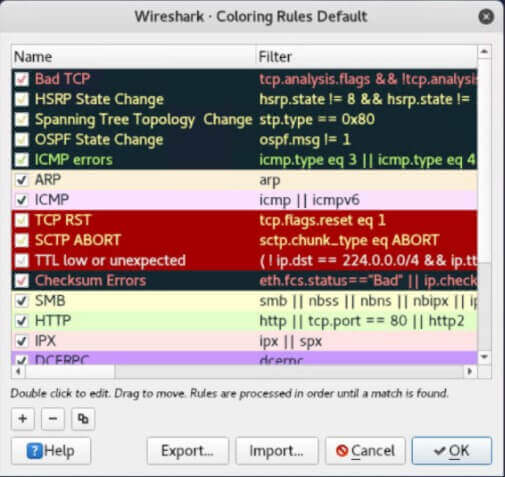
Wireshark highlights data packets based on several rules, summarized in the View, Staining Rules screen. They are freely customizable.
Wireshark allows you to filter the data packets in real-time, obtaining the display of only the information of interest or to perform a “skimming” afterward. By clicking on the icon to the left of the Apply a view filter field, you can access a series of pre-set filters. Alternatively, you can manually type the ones you want to use.
New ones can be preset by clicking on the Analyze menu, Display Filters.
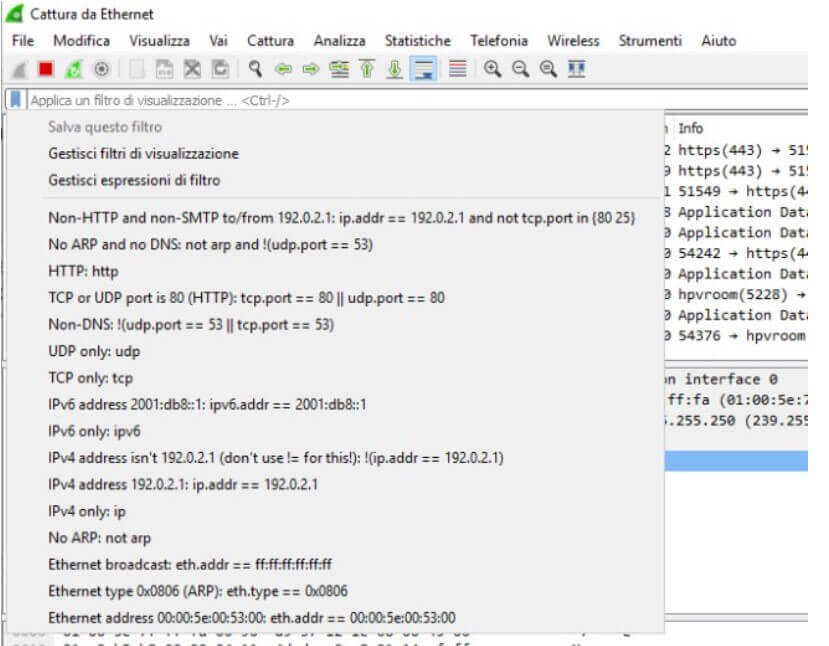
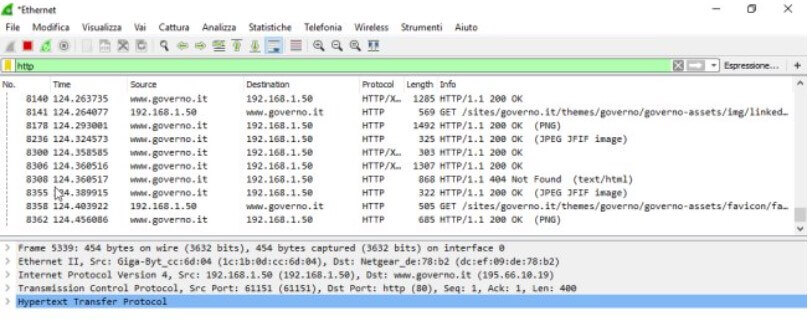
By typing, for example, tcp or udp in the box above, Wireshark will show – respectively – only the traffic on TCP or UDP protocol; writing http will show only the packets transmitted using the HTTP protocol without any form of encoding.
By typing, for example, bittorrent, it will be possible to establish which workstation the BitTorrent application is running by going back to the corresponding local address.
Using the syntax tcp.port == 9001 || tcp.port == 9030, it is possible to know which devices the Tor Browser software is possibly in use.
Wireshark also supports the auto-composition of the rules for display filters: by indicating part of a protocol’s name, for example, you can get suggestions on the usable syntax.
The complete list of filters that can be used with Wireshark is available on this page.
The Statistics section of Wireshark is incredibly useful because it allows you to instantly get an overview of everything happening on the local network: the list of websites visited, the devices ( terminators, endpoint translation ) that generate the most traffic, the heaviest activities, and so on.
For example, try to check what happens by choosingTerminators, then the IPv4 tab, and finally clicking on the Bytes column’s header: you will find the list of local systems and remote public addresses with which more data has been exchanged.
Using tcpdump it is possible to capture the traffic in advance and then give it later to Wireshark.

A tech-savvy writer with a knack for finding the latest technology in the market, this is what describes John Carter. With more than 8 years of experience as a journalist, John graduated as an engineer and ventured soon into the world of online journalism. His interest includes gadget reviews, decoding OS errors, hunting information on the latest technology, and so on.


